
README.md 3.2 KB
matplotlib-cpp
This is matplotlib-cpp, probably the simplest C++ plotting library. It is built to resemble the plotting API used by Matlab and matplotlib.
Usage
Complete minimal example:
#include "matplotlibcpp.h"
namespace plt = matplotlibcpp;
int main() {
    plt::plot({1,2,3,4});
    plt::show();
}

// g++ minimal.cpp -std=c++11 -lpython2.7
Result: 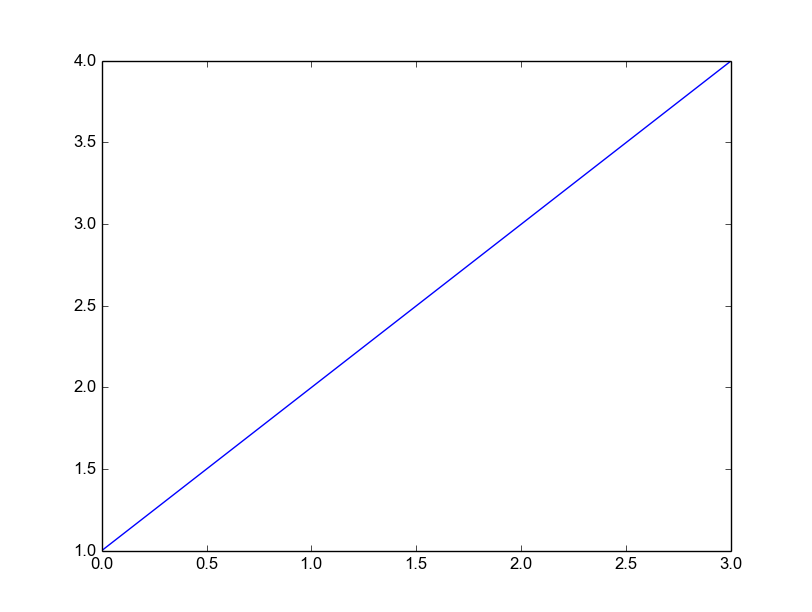
A more comprehensive example:
#include "matplotlibcpp.h"
#include <cmath>

namespace plt = matplotlibcpp;

int main()
{
    // Prepare data.
    int n = 5000;
    std::vector<double> x(n), y(n), z(n), w(n,2);
    for(int i=0; i<n; ++i) {
        x.at(i) = i*i;
        y.at(i) = sin(2*M_PI*i/360.0);
        z.at(i) = log(i);
    }

    // Plot line from given x and y data. Color is selected automatically.
    plt::plot(x, y);
    // Plot a red dashed line from given x and y data.
    plt::plot(x, w,"r--");
    // Plot a line whose name will show up as "log(x)" in the legend.
    plt::named_plot("log(x)", x, z);

    // Set x-axis to interval [0,1000000]
    plt::xlim(0, 1000*1000);
    // Enable legend.
    plt::legend();
    // Show plot
    plt::show();
}

// g++ basic.cpp -lpython2.7
Result: 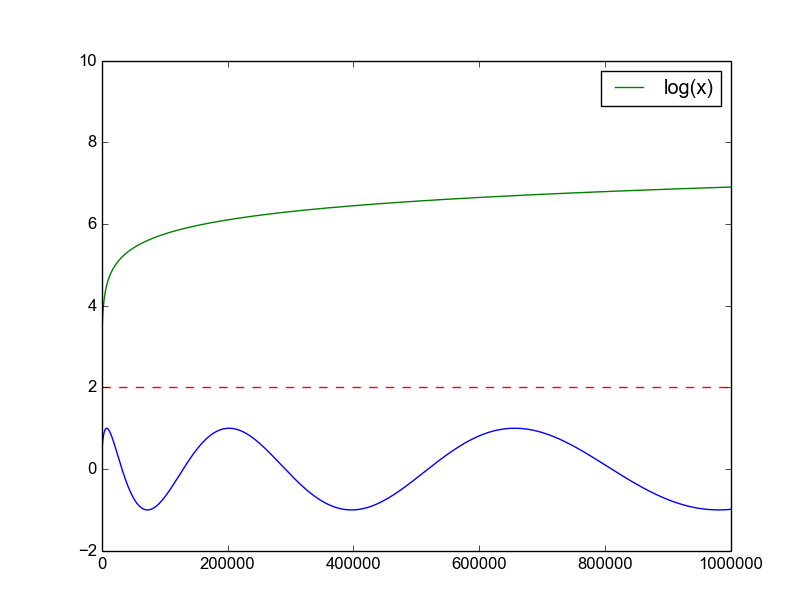
matplotlib-cpp doesn't require C++11, but will enable some additional syntactic sugar when available:
#include <cmath>
#include "matplotlibcpp.h"

using namespace std;
namespace plt = matplotlibcpp;

int main()
{
    // Prepare data.
    int n = 5000; // number of data points
    vector<double> x(n),y(n);
    for(int i=0; i<n; ++i) {
        double t = 2*M_PI*i/n;
        x.at(i) = 16*sin(t)*sin(t)*sin(t);
        y.at(i) = 13*cos(t) - 5*cos(2*t) - 2*cos(3*t) - cos(4*t);
    }

    // plot() takes an arbitrary number of (x,y,format)-triples.
    // x must be iterable (that is, anything providing begin(x) and end(x)),
    // y must either be callable (providing operator() const) or iterable.
    plt::plot(x, y, "r-", x, [](double d) { return 12.5+abs(sin(d)); }, "k-");


    // show plots
    plt::show();
}
Result: 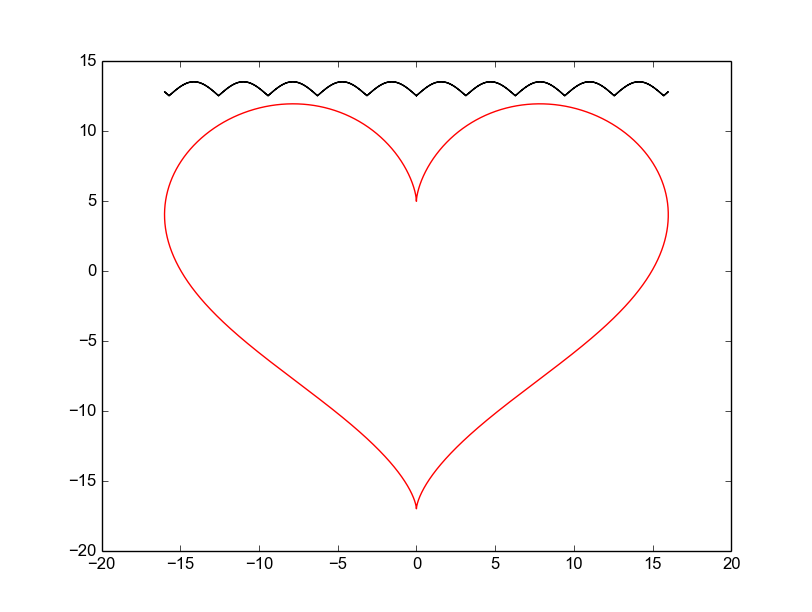
Installation
matplotlib-cpp works by wrapping the popular python plotting library matplotlib. (matplotlib.org) This means you have to have a working python installation, including development headers. On Ubuntu:
sudo aptitude install python-matplotlib python2.7-dev
The C++-part of the library consists of the single header file matplotlibcpp.h which can be placed
anywhere.
Since a python interpreter is opened internally, it is necessary to link against libpython2.7 in order to use
matplotlib-cpp.
(There should be no problems using python3 instead of python2.7, if desired)
Todo/Issues/Wishlist
It would be nice to have a more object-oriented design with a Plot class which would allow multiple independent plots per program.
Right now, only a small subset of matplotlibs functionality is exposed. Stuff like save()/xlabel()/ylabel() etc. should be easy to add.